Under-design risk
- Fatigue-critical hotspots remain invisible until field operation
- Reactive response after customer-side failures
- Warranty exposure and emergency service load
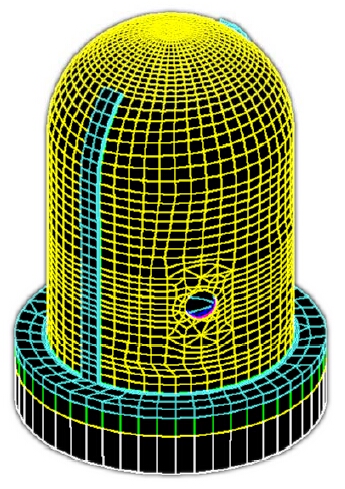
Agent-based fatigue workflow operating on existing FE results. Solver-agnostic, deterministic, and traceable by design.
15 min
target agent turnaround
3-5
pilot teams targeted
30-50%
downtime reduction benchmark range
Most machinery teams already run static and dynamic FEA, but fatigue assessment is still fragmented across manual extraction, spreadsheets, and ad-hoc scripts.
Current manual workflow
01
Extract nodal stresses from FE results
02
Identify critical locations manually
03
Look up S-N data from standards documents
04
Run rainflow counting in spreadsheets/scripts
05
Calculate cumulative damage with Miner's rule
06
Compile report manually for review
4-8h
Typical manual post-processing per analysis
0%
Built-in traceability in ad-hoc workflows
+/-30%
Analyst-to-analyst variance risk
Without systematized fatigue evidence, teams are forced toward either under-design risk or costly over-design.
Designed to fit existing engineering workflows while improving repeatability and review quality.
Works downstream of your current FE solver. No changes to model setup workflow.
Rainflow counting, S-N interpolation, and damage accumulation remain deterministic.
Each result links to source files, methods, assumptions, and selected standards context.
End-to-end flow from FE result ingestion to audit-ready reporting.
STEP 1
FE results (.op2/.h3d/.odb/.rst), load histories (CSV), and material parameters.
STEP 2
Stress extraction at critical regions, cycle decomposition, and mean-stress correction.
STEP 3
Damage accumulation, life estimation, and ranked critical locations.
STEP 4
PDF/Word output with audit trail, pass/fail framing, and integration-ready JSON.
Representative output styles for engineering review and decision support.
Auto-detected critical regions ranked by cumulative damage.

Load-history decomposition and cycle accounting for fatigue usage.
Traceable summaries for engineering, quality, and service teams.
Separation of concerns between AI orchestration and deterministic fatigue computation.
Web UI for file upload, parameter configuration, and report export.
Method-selection guidance, input checks, and standards-aware orchestration.
Deterministic Python stack for parsers, cycle counting, and damage calculation.
AI supports workflow orchestration and method guidance. Fatigue calculations remain deterministic so outputs are reproducible and audit-ready.
Every analysis run should produce a defensible, traceable audit package.
Only validated fatigue methods are enabled in governed configurations.
Invalid ranges are rejected before compute execution.
Inputs, model choices, curve IDs, and extraction regions are logged.
Identical inputs produce identical fatigue outputs.
Timestamped records of agent decisions and user overrides.
Method libraries and fatigue data are version-tagged for reviews.
Manual fatigue workflows versus a governed agent pipeline.
| Dimension | Manual process | Agent-based |
|---|---|---|
| Cycle time | 4-8 hours | ~15 minutes |
| Consistency | Analyst-dependent | Deterministic |
| Traceability | Implicit | Explicit and logged |
| Method selection | Manual lookup | Guided and standardized |
| Hotspot ID | Visual inspection | Ranked by damage |
| Reporting | Manual document assembly | Auto-generated with audit trail |
Solver and data formats prioritized for phased rollout.
.op2 .h3d
Phase 1 priority
Phase 1.op2
Shared parser path
Phase 1.odb
Python API integration
Phase 2.rst
Parser integration path
Phase 2CSV
Duty cycles and spectra
Phase 1S-N lib
Standards-aligned libraries
Phase 1Technical use-case framing based on your deep research report for industrial machinery fatigue-monitoring deployment.
Strong installed-base and uptime-driven packaging operations.
Lead use case
Sealing/cutting jaw drive fatigue monitoring with strain + vibration + drive telemetry.
Expected value focus
Target: earlier intervention planning and lower unplanned line-stop risk.
Modular bag-making and end-of-line systems with digital engineering signals.
Lead use case
Punch/perforation station fatigue monitoring for tool-holder and linkage components.
Expected value focus
Target: reduce crash events, scrap, and reactive maintenance.
Conveyor reliability business with service and remote diagnostics alignment.
Lead use case
Chain-drive and shaft fatigue monitoring from torque, vibration, and cycle patterns.
Expected value focus
Target: planned swaps before overload-driven failures.
Suggested first pilot: one high-cycle subsystem on a representative packaging machine with measurable success metrics in 3-6 months.
M1
Weeks 1-2: select subsystem, failure modes, and data access paths
M2
Weeks 3-4: instrumentation install and baseline capture
M3
Weeks 5-8: edge pipeline and first fatigue/risk outputs
M4
Weeks 9-12: threshold tuning with engineering + service teams
M5
Weeks 13-16: replicate on second machine and ROI playbook
Review these page decisions and tell me your choices. I will update the fatigue page in one pass.